حجم هذا العرض: 600 × 600 بكسل
الصورة بدقة كاملة (1,200 × 1,200 بكسل، حجم الملف: 18 كيلوبايت، نوع الملف: image/png)
Description
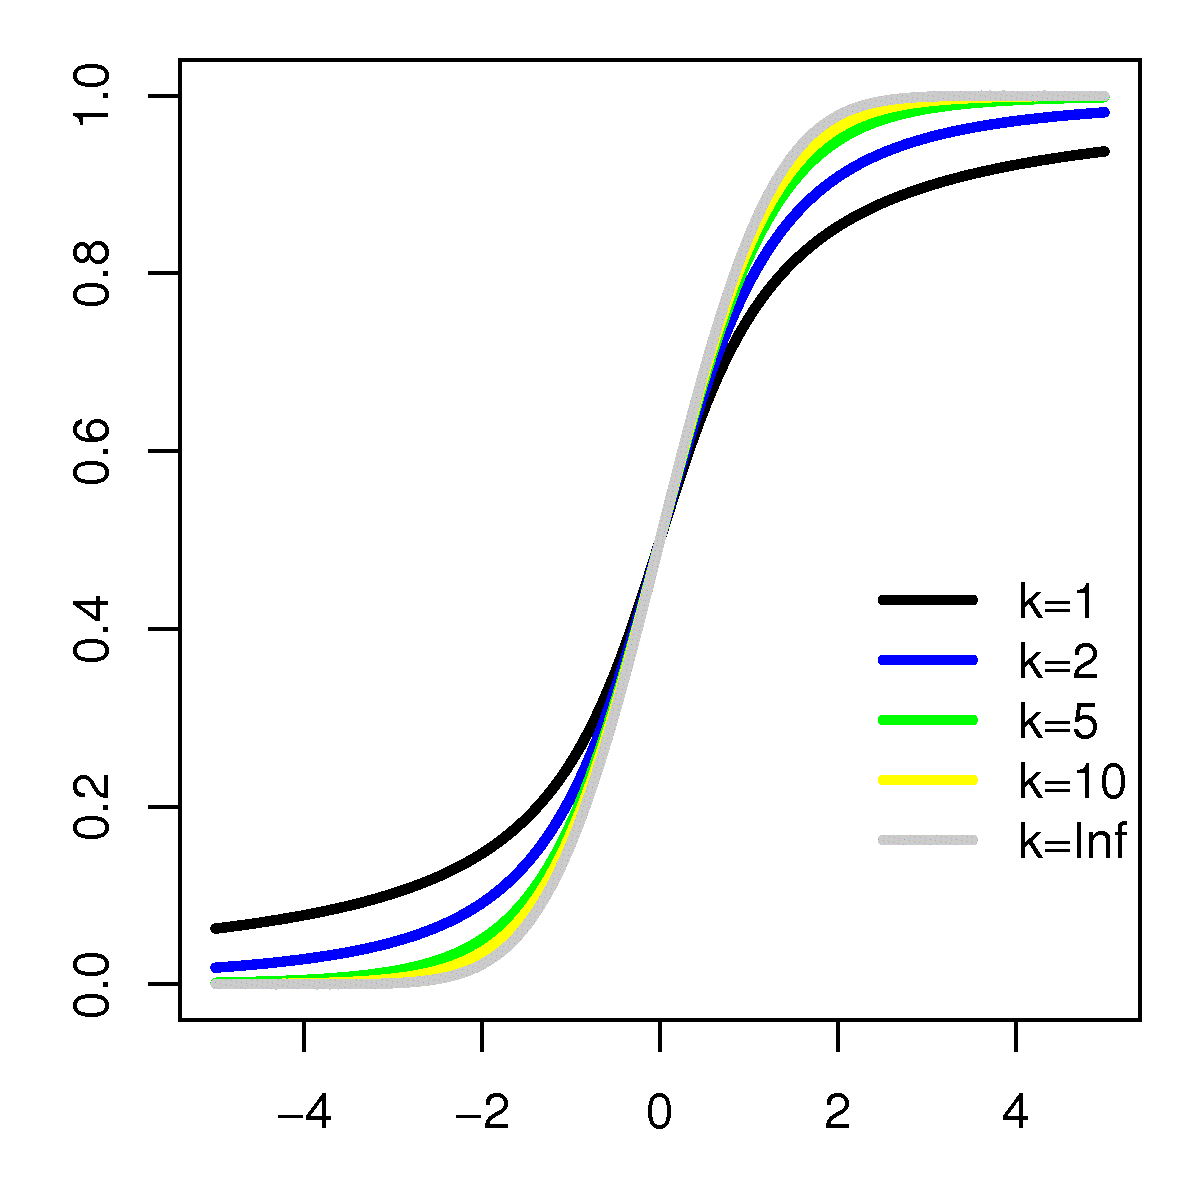
The CDF of the t-distribution
bitmap(file="t_distributionCDF.png",type="png256",width=4,height=4,res=300,pointsize=12) par(mar=c(3,3,1,1)) x <- seq(-5,5,len=1000) plot(range(x),c(0,1),type="n") lines(x,pt(x,df=1),col="black",lwd=3) lines(x,pt(x,df=2),col="blue",lwd=3) lines(x,pt(x,df=5),col="green",lwd=3) lines(x,pt(x,df=10),col="yellow",lwd=3) lines(x,pt(x,df=Inf),col="grey",lwd=3) legend(2,0.5,legend=c("k=1","k=2","k=5","k=10","k=Inf"),col=c("black","blue","green","yellow","grey"),lwd=3,bty="n") dev.off()
Licensing
 |
Permission is granted to copy, distribute and/or modify this document under the terms of the GNU Free Documentation License, Version 1.2 or any later version published by the Free Software Foundation; with no Invariant Sections, no Front-Cover Texts, and no Back-Cover Texts. Subject to disclaimers. |
وصلات
الصفحات التالية تحتوي على وصلة لهذه الصورة: